Packet Loss and Dropped Frames When Using Pktgen or TRex with Mellanox ConnectX-5 NICs in High-Traffic Scenarios

therealyou

New Member
My goal was to send traffic from Server A to Server B.
Pktgen was built without any issues, similarly with TRex. ***Both are different tools and were used separately***
I am able to run the Pktgen from usr/local/bin with appropriate command line arguments.
Destination mac address was set after running pktgen.
On the other server at first I used tcp-dump to capture the packets.
What I observed was that the amount of packets being transmitted = the amount of packets being dropped. This happened with both pktgen and TRex.
Then I used Wireshark to capture packets and Wireshark capture statistics:
Packets Captured: 16,044,383
Packets Displayed: 16,044,383
Dropped Packets: Unknown (Wireshark unable to capture this detail).

System Setup:
DPDK Version: 23.11.2
Pktgen Version: 24.07.1
Operating System: Linux 5.4.0-192-generic
CPU: Intel Xeon E5-2640 v4 @ 2.40GHz
Mellanox NICs: ConnectX-5 (MT27800 Family), using mlx5_core driver
Driver Bindings: Mellanox NICs are bound to mlx5_core.
Packet Capture: Performed with tcpdump and Wireshark on an identical server.

To tune my nics performance I followed this guide:
https://fasterdata.es.net/host-tuning/linux/

I am unable to identify the root cause of this issue as to why this is happening when all the settings and configurations are set correctly. Been Trying to solve this issue from the past week.
  1. Could this be a driver or DPDK configuration issue leading to packet loss?
  2. Are there any known issues with the mlx5_core driver and ConnectX-5 that could cause this?
  3. Suggestions for optimizing Pktgen for high throughput traffic to minimize packet loss?
Any help or further insights or suggestions to troubleshoot and resolve this issue would be greatly appreciated.
 
Hello,

It looks like you're on the right track, but I noticed a few things missing from your description that could help with troubleshooting.

  1. Performance Metrics: You didn’t provide any details on the actual performance metrics you're seeing (e.g., packet loss percentage, throughput numbers, CPU utilization). Understanding these would help narrow down if the issue is more CPU or NIC-bound.
  2. Packet Generation Parameters: Can you clarify the specifics of your traffic generation parameters (e.g., packet size, rates, protocols used)? If you are generating large volumes of traffic, packet sizes and generation rates can heavily impact performance, especially if the CPU is bottlenecked.
  3. Driver & DPDK Configuration: While you mentioned following a tuning guide, it would be helpful to know if you’ve checked for specific optimizations related to your NIC (e.g., using Mellanox's mlx5 tuning best practices). Mellanox NICs are often sensitive to driver version and specific configuration tweaks in high-performance scenarios, and there could be issues related to DPDK configuration (e.g., core isolation, NUMA awareness, or RX/TX descriptors).
  4. CPU Bottleneck: Generating traffic purely in software on the CPU can be taxing, especially for high-throughput testing. Consider offloading more of the workload directly to the NIC (if possible) to avoid overwhelming the CPU, particularly since your NIC supports DPDK. This can reduce the CPU burden and optimize traffic handling.
  5. Packet Capture: If you're seeing matching capture numbers and drops, it’s possible the issue lies within how the packets are being handled post-capture. Wireshark’s inability to capture dropped packets is a limitation, but you can cross-check by using hardware-level monitoring or DPDK's rte_eth_stats_get() to see if there’s packet loss happening on the NIC level.
  6. Suggestions:
    • Try reducing the packet generation rate temporarily to see if you can isolate the drop threshold.
    • Investigate NIC offloads (e.g., TSO, LRO, and RSS) to reduce CPU load.
    • Check Mellanox’s driver and DPDK documentation for any known issues or configuration guidelines specific to your NIC (ConnectX-5).
    • Ensure that your interrupts are evenly distributed across cores (ethtool -S can help).
I hope this helps guide your investigation. Let me know if you have additional performance data or results from further testing!
First of all thank you for your reply and suggestion beers, I missed out some crucial information to include, I have added them with this reply:
Regarding the performance metrics:
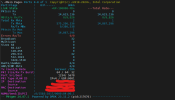
Below image describe the stats of the pktgen packets being sent
1728739409968.png

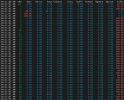
used mpstat -P ALL 1 to get the CPU stats and this was the statistics that I captured when running pktgen

1728739446663.png

tcpdump output:
655169 packets captured
26882048 packets received by filter
26226879 packets dropped by kernel
455950912 packets dropped by interface

Packet Generation parameters used:
Code:
sudo ./usr/local/bin/pktgen -l 2-4 -n 4 --proc-type auto --log-level 7 --file-prefix pg -a 0000:04:00.1 -- -v -T -P -m [3-4].0 -f themes/black-yellow.theme
parameters explanation
-l 2-4Core List: Specifies logical cores 2 to 4 (inclusive) for DPDK threads.
-n 4Memory Channels: Sets the number of memory channels per socket to 4.
--proc-type autoProcess Type: Automatically determines the process type (primary or secondary).
--log-level 7Log Level: Sets DPDK's log level to 7.
--file-prefix pgFile Prefix: Uses pg as a prefix for shared memory files and hugepages. Used to avoid conflicts with other DPDK applications.
-a 0000:04:00.1PCI Device: Attaches the network interface at PCI address 0000:04:00.1 to DPDK for packet generation.

I will look into the tuning for mellanox nics on the nvidia site.

Code:
ethtool -i enp4s0f1np1
driver: mlx5_core
version: 24.07-0.6.1
firmware-version: 16.35.4030 (MT_0000000008)
expansion-rom-version:
bus-info: 0000:04:00.1
supports-statistics: yes
supports-test: yes
supports-eeprom-access: no
supports-register-dump: no
supports-priv-flags: yes

As you suggested to try reducing the packet rate, I did try reducing the line rate to 10% and 1% and the result was the same.
In my case the packet size was 512, line rate was 10% and the protocol was UDP

NIC offloads such as LSO,TSO,GRO are all set to off

Code:
tcp-segmentation-offload: off
        tx-tcp-segmentation: off
        tx-tcp-ecn-segmentation: off [fixed]
        tx-tcp-mangleid-segmentation: off
        generic-receive-offload: off

For the last suggestion you gave, I checked and interrupts are not even distributed across all CPUs. I will look into this and see if distributing it evenly resolves this issue. But, thank you for your help and suggestions beers.
 
Back
Top